
Page 30 - IDEA Study 3 2018 Low skilled
P. 30
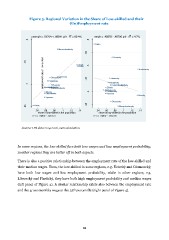
Figure 3. Regional Variation in the Share of Low-skilled and their (Un)Employment rate unemplr = .03764 + .88841 prir R2 = 60.4% emplr = .46878 - .48706 prir R2 = 4.7% Moravskoslezsky Praha Plzensky Ustecky Karlovarsky Liberecky Olomoucky Pardubicky Jihocesky Pardubicky KralovehrLaidbecrkeycky Zlinsky Jihomoravsky Stredocesky Vysocina Olomoucky Karlovar Ustecky .14 Plzensky JihomorJaivhsokcyesky Kralovehradecky Zlinsky Stredocesky Vysocina Praha .08 .1 n = 14 RMSE = .0216531 .14 .06 .08 .1 n = 14 RMSE = .0658139 .04 .06 share of low-skilled in the population .12 .04 share of low-skilled in the population Moravskoslezsky .12 Source: LFS data 2014-2016, own calculation. In some regions, the low-skilled face both low wages and low employment probability; in other regions they are better off in both aspects. There is also a positive relationship between the employment rate of the low-skilled and their median wages. Thus, the low-skilled in some regions, e.g. Ústecký and Olomoucký, have both low wages and low employment probability, while in other regions, e.g. Liberecký and Plzeňský, they have both high employment probability and median wages (left panel of Figure 4). A similar relationship exists also between the employment rate and the gross monthly wage at the 25th percentile (right panel of Figure 4). 28 sky .05 .1 .15 .2 employment rate of low-skilled .35 .4 .45 .5 .55 .6
