
Page 29 - IDEA Study 3 2018 Low skilled
P. 29
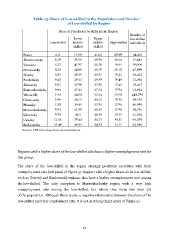
Table 23. Share of Low-skilled in the Population and Number of Low-skilled by Region Share of Population by Skills in the Region Number of low-skilled individuals Low-skilled Lower middle- skilled Upper middle- skilled High-skilled Praha 3.11 17.00 41.52 38.38 24,321 Jihomoravsky 5.28 31.66 36.82 26.23 31,333 Vysocina 5.77 41.87 35.76 16.61 18,009 Stredocesky 5.79 34.66 39.18 20.37 47,869 Zlinsky 5.87 40.01 35.61 18.52 22,472 Pardubicky 6.45 38.27 36.81 18.46 22,264 Jihocesky 6.82 37.86 37.85 17.47 25,327 Kralovehradecky 6.99 37.42 37.74 17.84 23,944 Whole CR 7.02 34.69 37.24 21.05 449,785 Olomoucky 7.06 39.01 35.77 18.15 26,061 Plzensky 7.38 36.91 37.85 17.86 26,680 Moravskoslezsky 8.83 37.68 35.61 17.89 65,713 Liberecky 8.89 39.2 35.29 16.61 22,364 Ustecky 13.35 38.43 34.71 13.51 69,389 Karlovarsky 13.49 39.67 34.73 12.11 24,040 Source: LFS data 2014-2016, own calculation. Regions with a higher share of the low-skilled also have a higher unemployment rate for this group. The share of the low-skilled in the region strongly positively correlates with their unemployment rate (left panel of Figure 3). Regions with a higher share of the low-skilled, such as Ústecký and Karlovarský regions, also have a higher unemployment rate among thelow-skilled. The only exception is Moravskoslezský region with a very high unemployment rate among the low-skilled, but where they form less than 9% of the population. Although there is also a negative relationship between the share of the low-skilled and their employment rate, it is not as strong (right panel of Figure 3). 27
