
Page 27 - IDEA Study 8 2017 Direct subsidies and R&D output in firms
P. 27
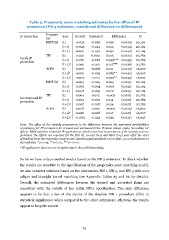
Table 5. Propensity score matching estimates by the office of IP protection (NN 3 estimator, conditional difference-in-differences) IP protection Czech IP protection International IP protection Program Year Treated Untreated me IMPULS (t) -0.015 -0.036 (t+1) -0.025 -0.044 Difference 0.020 (0.033) 0.019 (0.034) 0.052 (0.040) 0.013 (0.034) 0.099*** (0.035) 0.127*** (0.036) 0.014 (0.045) 0.085** (0.042) 0.095** (0.045) 0.005 (0.015) 0.009 (0.015) 0.010 (0.015) -0.003 (0.017) 0.011 (0.017) 0.014 (0.017) -0.002 (0.024) N 20,104 20,104 20,104 20,783 20,783 20,783 16,027 16,027 16,027 20,104 20,104 20,104 20,783 20,783 20,783 16,027 (t+2) 0.020 TIP (t) 0.022 (t+1) 0.076 (t+2)† 0.096 ALFA (t) 0.006 (t+1)† 0.020 (t+2)† -0.017 IMPULS (t) 0.003 (t+1) 0.005 (t+2) 0.008 TIP (t) 0.009 (t+1) 0.009 (t+2)† 0.007 ALFA (t) 0.008 (t+1)† 0.008 -0.032 0.009 -0.022 -0.031 -0.008 -0.065 -0.112 -0.003 -0.004 -0.003 0.012 -0.002 -0.007 0.010 -0.008 0.017 (0.017) 16,027 0.022 (0.021) 16,027 (t+2)† -0.003 -0.024 Note: The effect of the subsidy programme is the difference between the estimated probabilities of applying for IP protection for treated and untreated firms. Positive values imply “crowding-in” effects: R&D subsidies stimulate IP applications, which would not be produced, if the subsidy was not provided. The effects are reported for the first (t), second (t+1) and third (t+2) year after the start of funding from the respective programme. Bootstrapped standard errors after 1,000 replications in parentheses; * p<0.05, ** p<0.01, *** p<0.001. † IP application data are not complete due to the publishing delay. So far we have only presented results based on the NN 3 estimator. To check whether the results are sensitive to the specification of the propensity score matching model, we also consider evidence based on the alternatives NN 1, NN 5, and NN 3 with 0.01 caliper and biweight kernel matching (see Appendix Tables A5 and A6 for details). Overall, the estimated differences between the treated and untreated firms are consistent with the results of the initial NN 3 specification. The only difference appears to be that a few of the results of the simplest NN 1 procedure differ in statistical significance when compared to the other estimators; otherwise the results appear to be quite robust. 25
