
Page 25 - IDEA Studie 07 2023 TACR
P. 25
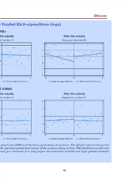
 y funded R&D expenditure (logs)
MEs
the subsidy
n function fit
After the subsidy
Regression function fit
n
Polynomial fit of order 1
Sample average within bin Polynomial fit of order 1
After the subsidy
Regression function fit
E FIRMS the subsidy
n function fit
n
0
0 5 -5 0 5
Polynomial fit of order 1 Sample average within bin Polynomial fit of order 1
4 3 2 1 0
-1
0 5 -5 0 5
8 6 4 2
r panel is for SMEs and the lower panel shows large firms. The left plot refers to the period ots represent points-level means of the outcome using 20 bins. The fitted lines are derived onal pre-treatment firm and project characteristics (middle and right panels) included
23
IDEA 2023
