
Page 27 - IDEA Studie 07 2023 TACR
P. 27
ARE SUBSIDIES TO BUSINESS R&D EFFECTIVE? REGRESSION
DISCONTINUITY EVIDENCE FROM THE TA CR ALFA PROGRAMME IDEA 2023
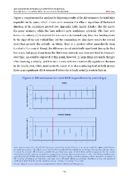
Figure 2 complements the analysis by depicting results of the RD estimates for total R&D expenditures by years, which allows us to examine the effects regardless of the formal duration of the subsidised project (see Appendix Table A4 for details). The dot shows the point estimate, while the bars indicate 90% confidence intervals. The base year before the subsidy (t) is depicted by zero on the horizontal axis; thus, the funding starts to the right of the red vertical line, but for comparison we also show results for several years that precede the subsidy. In SMEs, there is a positive effect immediately from the start of the project, though the difference is not statistically significant during the first two years, but gains steam from the third year onwards and does not tend to evaporate over time. As could be expected at this point, however, in large firms not much changes after receiving a subsidy, and the results even indicate a statistically significant decrease in the fourth year, when most projects expire. It is also reassuring that in both groups there is no significant effect estimated before the subsidy actually starts to kick in.
Figure 2: RD estimates for total R&D expenditure by year (logs)
SMEs
1.5 1.0 0.5
0 -0.5 -1.0
1.5 1.0 0.5
0 -0.5 -1.0
Note: RD estimates for a bandwith of 5 points around the cutoff. Columns 2–7 report results for SMEs and Columns 8–13 for large firms. The effects are estimated during (d) and after (d+3) the period of receiving the subsidy, where d varies by project. All estimates include the pre-treatment logs of total R&D, R&D components by the source of funding and the type of expenditure, a patenting dummy, logs of employment, sales and labour productivity, age, dummies for foreign ownership, stockholding, Prague location, and co-operation with a research organisation, the number of project participants, and year and call fixed effects as controls. Standard errors are clustered at the firm level. N is the number of observations. * p<0.1, ** p<0.05, *** p<0.01.
Source: Based on micro data from CZSO (2022), ISVaV (2022) and TACR (2017).
-3 -2 -1 0 1 2 3 4 5 6 7
LARGE FIRMS
-3 -2 -1 0 1 2 3 4 5 6 7
25
Log change relative to year 0 Log change relative to year 0
