
Page 42 - IDEA Studie 07 2023 TACR
P. 42
ARE SUBSIDIES TO BUSINESS R&D EFFECTIVE? REGRESSION
DISCONTINUITY EVIDENCE FROM THE TA CR ALFA PROGRAMME IDEA 2023
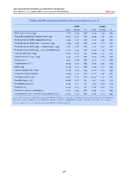
Table A3 RD estimates before the treatment (t-3 to t)
SME Large
Coef. St. err. N Coef. St. err. N
R&D expenditure (log) -0.16 0.39 797 -0.46 0.34 370
Privately funded R&D expenditure (log) -0.24 0.41 797 -0.55 0.36 370
Publicly-funded R&D expenditure (log) 0.05 0.37 797 -0.11 0.45 370
Publicly-funded R&D exp. – national (log) -0.05 0.40 797 0.14 0.60 370
Publicly-funded R&D exp. – international (log) 0.15 0.17 797 0.20 0.41 370
Publicly-funded R&D exp. – tax incentives (log) -0.61 0.44 797 -0.92 1.03 370
Current R&D exp. (log) -0.24 0.31 797 -0.29 0.33 370
Investment R&D exp. (log) -0.31 0.37 797 -0.37 0.80 370
Patents (1/0) -0.01 0.08 797 -0.12 0.22 370
Employment (FTE) -0.25 0.27 785 0.20 0.47 369
Sales (log) -0.39 0.33 766 0.28 0.63 356
Labour productivity (log) -0.14 0.15 754 -0.18 0.19 356
Time since incorporation -0.99 1.49 797 -2.16 3.36 370
Foreign-owned (1/0) 0.20* 0.12 797 -0.49** 0.23 370
Stockholding (1/0) -0.28* 0.16 797 0.61** 0.25 370
Manufacturing (1/0) 0.09 0.17 797 0.03 0.08 370
Prague (1/0) -0.12 0.15 797 0.06 0.10 370
Number of project participants -0.11 0.43 880 0.14 0.72 392
Co-operation with a research organisation (1/0) 0.04 0.03 880 0.05 0.09 392
Note: All estimates include the year and call fixed effects as controls. Standard errors are clustered at the firm level. N is the number of observations left (untreated) or right (treated) of the cutoff. * p<0.05, ** p<0.01, *** p<0.001.
Source: Based on micro data from CZSO (2022) and TACR (2017).
40
