
Page 50 - IDEA Study 8 2017 Direct subsidies and R&D output in firms
P. 50
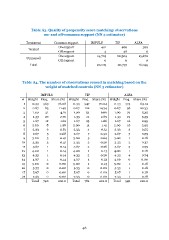
Table A3. Quality of propensity score matching: observations on- and off-common support (NN 3 estimator) Treatment Treated Untreated Common support On support Off support On support Off support IMPULS TIP 401 460 3 28 19,705 20,309 0 0 ALFA 369 6 15,670 0 16,045 Total 20,109 20,797 Table A4. The number of observations reused in matching based on the weight of matched controls (NN 3 estimator) IMPULS TIP ALFA Weight Freq. 0.33 375 0.67 56 1.00 29 1.33 29 1.67 16 2.00 16 2.33 3 2.67 3 3.00 1 3.33 2 3.67 3 4.00 1 4.33 4 4.66 0 5.00 1 5.33 1 5.67 1 7.33 1 Total 542 Weight Freq. Share (%) Weight Freq. Share (%) 0.33 563 76.08 0.67 85 11.49 1.00 31 4.19 1.33 20 2.70 1.67 12 1.62 2.00 8 1.08 2.33 6 0.81 2.67 5 0.68 3.00 3 0.41 3.33 3 0.41 3.67 1 0.14 4.00 1 0.14 4.33 1 0.14 4.67 1 0.14 5.00 0 0.00 5.33 0 0.00 5.67 0 0.00 7.33 0 0.00 0.33 547 70.04 0.67 112 14.34 1.00 52 6.66 1.33 21 2.69 1.67 13 1.66 2.00 11 1.41 2.33 4 0.51 2.67 7 0.90 3.00 5 0.64 3.33 2 0.26 3.67 2 0.26 4.00 1 0.13 4.33 2 0.26 4.67 1 0.13 5.00 1 0.13 5.33 0 0.00 5.67 0 0.00 7.33 0 0.00 # 1 2 3 4 5 6 7 8 9 10 11 12 13 14 15 16 17 21 Total 740 100.0 Total 781 100.0 Share (%) 69.19 10.33 5.35 5.35 2.95 2.95 0.55 0.55 0.18 0.37 0.55 0.18 0.74 0.00 0.18 0.18 0.18 0.18 100.0 48
