
Page 48 - IDEA Study 8 2017 Direct subsidies and R&D output in firms
P. 48
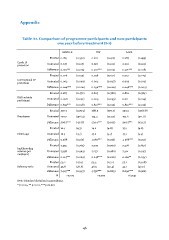
Appendix Table A1. Comparison of programme participants and non-participants one year before treatment (t-1) Czech IP protection International IP protection R&D subsidy participant Employees Firm's age log(Operating revenue per employee) Solvency ratio IMPULS Treated 0.189 Untreated 0.017 Difference 0.173*** Treated 0.026 Untreated 0.002 Difference 0.024*** Treated 0.667 Untreated 0.008 Difference 0.659*** Treated 477.4 Untreated 170.7 Difference 306.7*** Treated 10.7 Untreated 10.4 Difference 0.288 Treated 7.452 Untreated 7.338 Difference 0.114*** Treated 53.2 Untreated 45.8 Difference 7.415*** (0.392) (0.127) (0.015) (0.159) (0.046) (0.006) (0.472) (0.091) (0.018) (1179.9) (406.4) (43.77) (4.3) (4.7) (0.164) (0.765) (0.963) (0.029) (25.9) (28.8) (0.943) TIP 0.216 0.016 0.201*** 0.038 0.002 0.036*** 0.825 0.009 0.816*** 388.5 154.2 234.4*** 14.2 13.2 1.083*** 7.505 7.257 0.248*** 53.3 48.5 4.756*** 20,797 (0.412) (0.124) (0.013) (0.191) (0.047) (0.006) (0.380) (0.095) (0.012) (777.3) (313.5) (24.63) (4.8) (5.7) (0.156) (0.790) (0.986) (0.026) (25.2) (30.4) (0.825) ALFA 0.287 0.016 0.271*** 0.051 0.002 0.048*** 0.821 0.011 0.810*** 393.3 152.6 240.7*** 15.7 13.7 1. 988*** 7.408 7.301 0.106** 57.2 49.1 8.090*** 16,045 (0.453) (0.123) (0.018) (0.219) (0.104) (0.009) (0.384) (0.104) (0.016) (1066.8) (311.6) (43.13) (4.6) (5.5) (0.192) (0.821) (0.915) (0.034) (23.08) (30.0) (0.962) N 20,109 Note: Standard deviation in parentheses. * p<0.05, ** p<0.01, *** p<0.001 46
