
Page 57 - IDEA Study 8 2017 Direct subsidies and R&D output in firms
P. 57
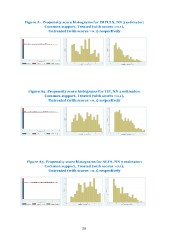
Figure A1. Propensity score histograms for IMPULS, NN 3 estimator: Common support, Treated (with scores >0.1), Untreated (with scores >0.1) respectively Figure A2. Propensity score histograms for TIP, NN 3 estimator: Common support, Treated (with scores >0.1), Untreated (with scores >0.1) respectively Figure A3. Propensity score histograms for ALFA, NN 3 estimator: Common support, Treated (with scores >0.1), Untreated (with scores >0.1) respectively 55
