
Page 59 - IDEA Study 8 2017 Direct subsidies and R&D output in firms
P. 59
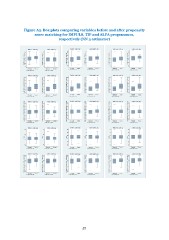
Figure A5. Box plots comparing variables before and after propensity score matching for IMPULS, TIP and ALFA programmes, respectively (NN 3 estimator) 57
