Page 22 - IDEA Duchodova studie
P. 22

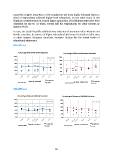
countries a higher proportion of the populations are more highly educated (about a
third of respondents achieved higher level education); on the other hand, in the
Southern countries there is a much higher proportion of individuals with lower level
education (at age 50–54 years, around half the respondents; for older cohorts, as
many as 80%).

In sum, the Czech Republic exhibits lower educational attainment than Western and
Nordic countries. Its pattern of higher educational attainment is similar to that seen
in other Eastern European countries. Southern Europe has the lowest levels of
educational attainment.

GRAPH 2.1

      Percentage of Men with Lower Education                                                                               Percentage of Women with Lower Education

100%                                                                                                                 100%

80%                                                           S  S                                                   80% S S S
                                         SS
60%                       S                                      NE                                                  60% S               S                                         E
                S                                                W                                                                              S

40%                                                                                                                                                                                N
                                                                                                                                                                                   W
20% WNE                                                 N                                                            40%                           E                           NE
 0%                       WNE  WN  N                    WE                                                                           WE  WNE WNE   WN                          W
                                   W
                               EE
                                                                                                                     20% N

                                                                                                                     0%

                          Age group - men (years)                W age, gender, educ.                                                            Age group - women (years)         W age, gender, educ.
                                                                                                                           Source: Data SHARE
      Source: Data SHARE                                         _____________________________________________                                                                     ____________________________________________

                                                                 P age, gender                                                                                                     P age, gender

GRAPH 2.2

      Percentage of Men with Middle Education                                                                              Percentage of Women with Middle Education

100%                                                                                                                 100%

80%                                                                                                                  80%
                E
                          EE                                                                                         60%                 EE
60%                                             EE                                                                                              W
                W
                          W    W   W                             WE                                                         E            WN        E                           E
40% NS                    NS   N                                 N                                                                                 W                           W
                                                        W        S                                                   40%   W                                                       W
20%                                N                    N                                                                  N

 0%                                S                                                                                        S            NN                                    N   E
                                                                                                                                                                                   N
                               SS                                                                                    20% S S

                                                                                                                                                   SSS

                                                                                                                     0%

                               Age group - men (years)           W age, gender, educ.                                                               Age group - women (years)      W age, gender, educ.
      Source: Data SHARE                                                                                                   Source: Data SHARE
                                                                 ______________________________________________                                                                    ______________________________________________

                                                                 P age, gender                                                                                                     P age, gender

                                                                                                                 20
   17   18   19   20   21   22   23   24   25   26   27