
Page 14 - IDEA Study 3 2018 Low skilled
P. 14
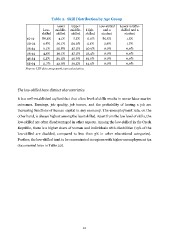
Table 2. Skill Distribution by Age Group Low- skilled Lower middle- skilled Upper middle- skilled High- skilled Low-skilled and a student Lower middle- skilled and a student 15-19 88.3% 4.1% 7.5% 0.0% 85.5% 1.5% 20-24 9.8% 20.1% 59.0% 11.1% 2.6% 1.7% 25-34 6.1% 25.8% 37.2% 30.9% 0.0% 0.0% 35-44 4.3% 36.1% 37.2% 22.4% 0.0% 0.0% 45-54 5.5% 39.3% 35.6% 19.6% 0.0% 0.0% 55-64 11.7% 43.9% 29.5% 14.9% 0.0% 0.0% Source: LFS data 2014-2016, own calculation. The low-skilled have distinct characteristics. It is a well-established stylized fact that a low level of skills results in worse labor market outcomes. Earnings, job quality, job tenure, and the probability of having a job are increasing functions of human capital in any economy. The unemployment rate, on the other hand, is always highest among the least skilled. Apart from the low level of skills, the low-skilled are often disadvantaged in other aspects. Among the low-skilled in the Czech Republic, there is a higher share of women and individuals with disabilities (15% of the low-skilled are disabled, compared to less than 3% in other educational categories). Further, the low-skilled tend to be concentrated in regions with higher unemployment (as documented later in Table 22). 12
