
Page 16 - IDEA Study 3 2018 Low skilled
P. 16
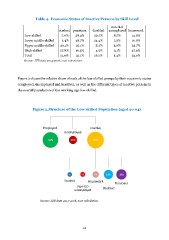
Table 4. Economic Status of Inactive Persons by Skill Level student pensioner disabled non-ILO unemployed housework Low-skilled 7.0% 38.3% 30.7% 8.7% 14.9% Lower middle-skilled 2.4% 48.7% 24.4% 7.2% 16.9% Upper middle-skilled 39.1% 25.1% 8.2% 3.6% 23.7% High-skilled 27.8% 16.3% 4.5% 3.1% 47.9% Total 21.0% 33.1% 16.2% 5.4% 23.9% Source: LFS data 2014-2016, own calculation. Figure 2 shows the relative share of each of the low-skilled groups by their economic status (employed, unemployed and inactive), as well as the different types of inactive persons in the overall population of the working age low-skilled. Figure 2.Structure of the Low-skilled Population (aged 20-64) Source: LFS data 2014-2016, own calculation. 14
