
Page 15 - IDEA Study 3 2018 Low skilled
P. 15
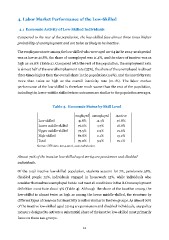
4. Labor Market Performance of the Low-Skilled 4.1 Economic Activity of Low-Skilled Individuals Compared to the rest of the population, the low-skilled face almost three times higher probability of unemployment and are twice as likely to be inactive. The employment rate among the low-skilled who were aged 20-64 in the 2014-2016 period was as low as 41.8%, the share of unemployed was 11.4%, and the share of inactive was as high as 46.8% (Table 3). Compared with the rest of the population, the employment rate is almost half of the overall employment rate (75%), the share of the unemployed is almost three times higher than the overall share in the population (3.9%), and the inactivity rate more than twice as high as the overall inactivity rate (21.1%). The labor market performance of the low-skilled is therefore much worse than the rest of the population, including the lower-middle skilled whose outcomes are similar to the population averages. Table 3. Economic Status by Skill Level Source: LFS data 2014-2016, own calculation. Almost 70% of the inactive low-skilled aged 20-64 are pensioners and disabled individuals. Of the total inactive low-skilled population, students account for 7%, pensioners 38%, disabled people 31%, individuals engaged in housework 15%, while individuals who consider themselves unemployed but do not meet all conditions in the ILO unemployment definition constitute about 9% (Table 4). Although the share of the inactive among the low-skilled is almost twice as high as among the lower middle-skilled, the structure by different types of (reasons for) inactivity is rather similar in the two groups. As almost 70% of the inactive low-skilled aged 20-64 are pensioners and disabled individuals, any policy measure designed to activate a substantial share of the inactive low-skilled must primarily focus on these two groups. employed unemployed inactive Low-skilled 41.8% 11.4% 46.8% Lower middle-skilled 76.6% 4.7% 18.8% Upper middle-skilled 75.5% 2.9% 21.6% High-skilled 82.8% 2.1% 15.2% Total 75.0% 3.9% 21.1% 13
