
Page 18 - IDEA Study 3 2018 Low skilled
P. 18
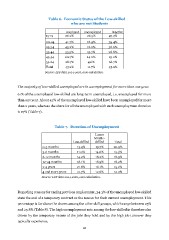
Table 6. Economic Status of the Low-skilled who are not Students employed unemployed inactive 15-19 26.2% 26.5% 47.3% 20-24 41.7% 18.9% 39.4% 25-34 45.2% 16.2% 38.6% 35-44 55.5% 15.7% 28.8% 45-54 60.7% 14.0% 25.2% 55-64 28.7% 4.6% 66.7% Total 43.2% 11.7% 45.0% Source: LFS data 2014-2016, own calculation. The majority of low-skilled unemployed are in unemployment for more than one year. 61% of the unemployed low-skilled are long-term unemployed, i.e. unemployed for more than one year. About 43% of the unemployed low-skilled have been unemployed for more than 2 years, whereas the share for all the unemployed with such unemployment duration is 27% (Table 7). Table7. DurationofUnemployment Low-skilled Lower Middle- skilled Total 0-3 months 13.4% 19.7% 20.9% 3-6 months 11.0% 14.6% 15.3% 6-12 months 14.2% 18.2% 18.5% 12-24 months 18.1% 18.9% 18.2% 2-4 years 21.6% 16.1% 15.2% 4 and more years 21.7% 12.6% 12.0% Source: LFS data 2014-2016, own calculation. Regarding reasons for ending previous employment, 34.3% of the unemployed low-skilled state the end of a temporary contract as the reason for their current unemployment. This percentage is far above the shares among the other skill groups, which range between 23% and 25.8% (Table 8). The high unemployment rate among the low-skilled is therefore also driven by the temporary nature of the jobs they hold and by the high job turnover they typically experience. 16
