
Page 20 - IDEA Study 3 2018 Low skilled
P. 20
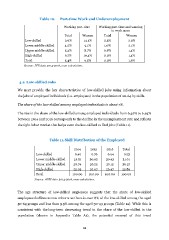
Table 10. Part-time Work and Underemployment Working part-time Working part-time and wanting to work more Total Women Total Women Low-skilled 9.6% 14.1% 2.3% 2.9% Lower middle-skilled 4.2% 9.1% 1.0% 2.1% Upper middle-skilled 5.3% 8.7% 0.8% 1.4% High-skilled 6.7% 10.4% 0.9% 1.4% Total 5.4% 9.5% 0.9% 1.6% Source: LFS data 2014-2016, own calculation. 4.2 Low-skilled Jobs We next provide the key characteristics of low-skilled jobs using information about the jobs of employed individuals (i.e. employees) in the population of 20-64 by skills. The share of the low-skilled among employed individuals is about 7%. The rise in the share of the low-skilled among employed individuals from 6.46% to 6.94% between 2014 and 2016 corresponds to the decline in the unemployment rate and reflects the tight labor market that helps even the low-skilled to find jobs (Table 11). Table 11. Skill Distribution of the Employed 2014 2015 2016 Total Low-skilled 6.46 6.76 6.94 6.73 Lower middle-skilled 31.75 30.92 30.43 31.01 Upper middle-skilled 36.74 36.25 36.15 36.37 High-skilled 25.05 26.07 26.47 25.89 Total 100.00 100.00 100.00 100.00 Source: AEIS data 2014-2016, own calculation. The age structure of low-skilled employees suggests that the share of low-skilled employees declines across cohorts as there is over 8% of the low-skilled among the aged 50-64 groups and less than 5.5% among the aged 30-49 groups (Table 12). While this is consistent with the long-term decreasing trend in the share of the low-skilled in the population (shown in Appendix Table A1), the potential reversal of this trend 18
