
Page 19 - IDEA Study 3 2018 Low skilled
P. 19
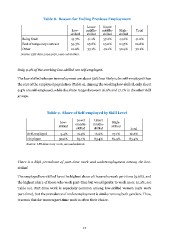
Table 8. Reason for Ending Previous Employment Low- skilled Lower middle- skilled Upper middle- skilled High- skilled Total Being fired 44.7% 41.1% 37.0% 44.6% 41.2% End of temporary contract 34.3% 25.8% 23.0% 24.5% 26.8% Other 21.0% 33.1% 40.1% 30.9% 32.1% Source: LFS data 2014-2016, own calculation. Only 9.4% of the working low-skilled are self-employed. The low-skilled who are in employment are about 50% less likely to be self-employed than the rest of the employed population (Table 9). Among the working low-skilled, only about 9.4% are self-employed, while the share ranges between 16.6% and 17.1% in the other skill groups. Table 9. Share of Self-employed by Skill Level Source: LFS data 2014-2016, own calculation. There is a high prevalence of part-time work and underemployment among the low- skilled. The employed low-skilled have the highest share of those who work part-time (9.6%), and the highest share of those who work part-time but would prefer to work more (2.3%, see Table 10). Part-time work is especially common among low-skilled women (14% work part-time), but the prevalence of underemployment is similar among both genders. Thus, it seems that for women part-time work is often their choice. Low- skilled Lower middle- skilled Upper middle- skilled High- skilled Total Self-employed 9.4% 16.9% 16.6% 17.1% 16.6% Employee 90.6% 83.1% 83.4% 82.9% 83.4% 17
