
Page 21 - IDEA Study 3 2018 Low skilled
P. 21
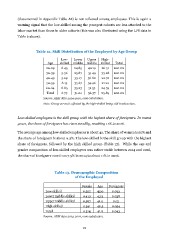
(documented in Appendix Table A2) is not reflected among employees. This is again a warning signal that the low-skilled among the youngest cohorts are less attached to the labor market than those in older cohorts (this was also illustrated using the LFS data in Table 6 above). Table 12. Skill Distribution of the Employed by Age Group Age Low- skilled Lower middle Upper middle High- skilled Total 20-29 8.45 24.85 40.19 26.51 100.00 30-39 5.36 25.87 35.49 33.28 100.00 40-49 5.29 35.17 36.82 22.72 100.00 50-59 8.15 35.67 34.96 21.22 100.00 60-64 8.85 35.23 31.53 24.39 100.00 Total 6.73 31.01 36.37 25.89 100.00 Source: AEIS data 2014-2016, own calculation. Note: Group 20-29 is affected by the high-skilled being still in education. Low-skilled employees is the skill group with the highest share of foreigners. In recent years, the share of foreigners has risen steadily, reaching 11% in 2016. The average age among low-skilled employees is about 42. The share of women is 55% and the share of foreigners is about 9.3%. The low-skilled is the skill group with the highest share of foreigners, followed by the high skilled group (Table 13). While the age and gender composition of low-skilled employees was rather stable between 2014 and 2016, the share of foreigners rose from 7.5% in 2014 to about 11% in 2016. Table 13. Demographic Composition of the Employed Source: AEIS data 2014-2016, own calculation. Female Age Foreigners Low-skilled 0.552 42.0 0.093 Lower middle-skilled 0.419 43.2 0.038 Upper middle-skilled 0.567 41.0 0.03 High-skilled 0.541 40.5 0.054 Total 0.514 41.6 0.043 19
